
时间: 2018/09/29 09:02:08
前言:监控web网站方法有很多种,这篇文章说一下对windows服务器 asp.net网站的监控
采用的方案,Powershell + Influxdb + Grafana
PowerShell用来收集IIS指标,10秒采集一次,然后写入Influxdb,主要代码如下:需要注意PowerShell需要升级到5.0才能支持influxdb
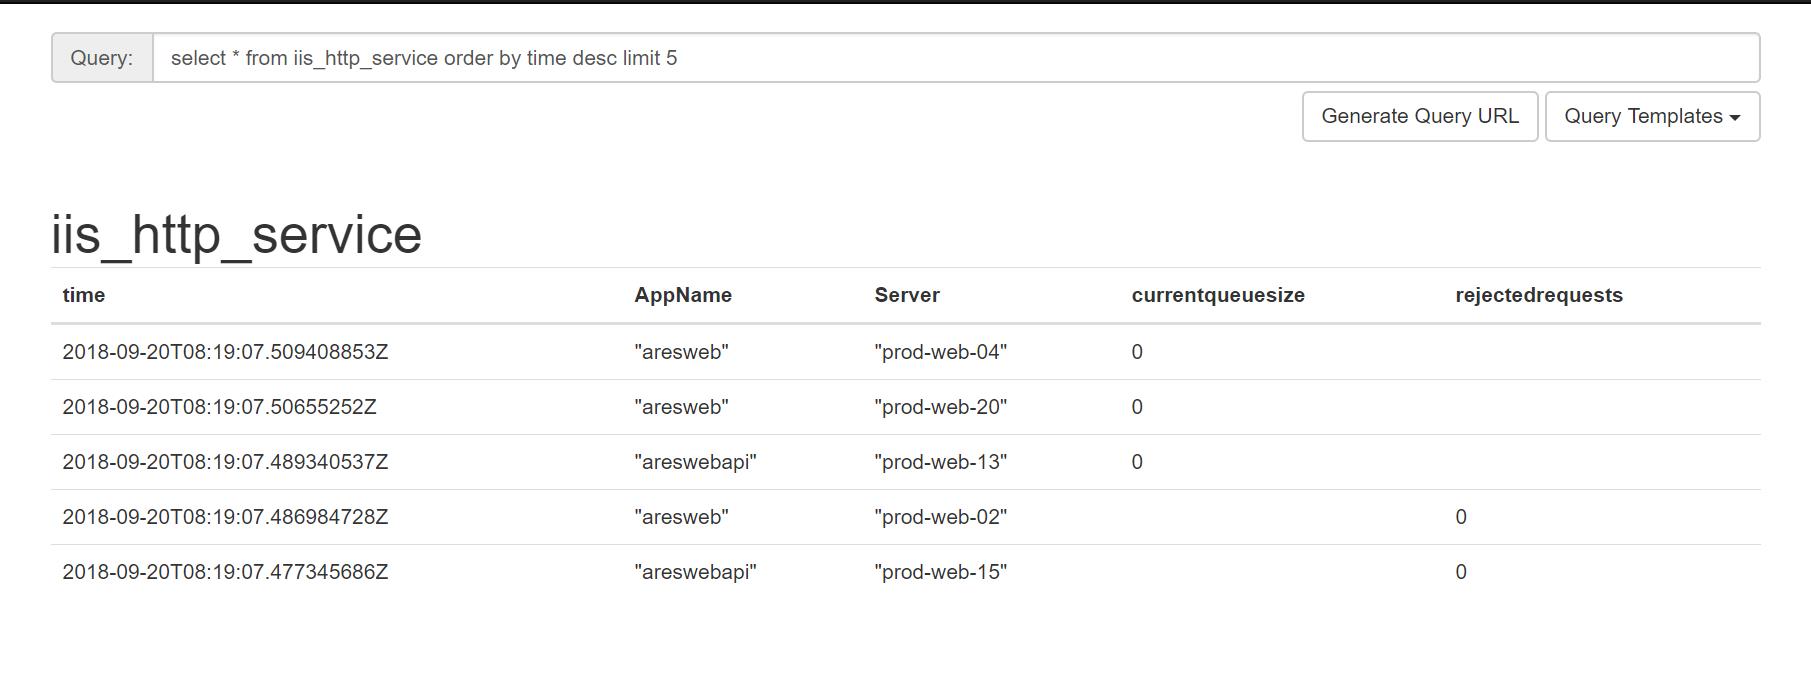
标签分别是:Server主机名 ,AppName是网站名称
 1 function waitsec{
 2     $step=10 #设置间隔
 3     $add=0 #设置延时
 4     $t=(get-date)
 5     $step-(($t.Hour*3600+$t.Minute*60+$t.Second)%$step)+$add
 6 }
 7 function GetData($cluster,$dept,$group,$project,$type)
 8 {
 9     $commandSet=@(
10     "Web Service(*)Current Anonymous Users",
11     "Web Service(*)Current Connections",
12     "Web Service(*)Current NonAnonymous Users",
13     "Web Service(*)Current Blocked Async I/O Requests",
14     "Web Service(*)Maximum Anonymous Users",
15     "Web Service(*)Measured Async I/O Bandwidth Usage",
16     "Web Service(*)Total Blocked Async I/O Requests",
17     "Web Service(*)Total Get Requests",
18     "Web Service(*)Total Method Requests",
19     "Web Service(*)Total Method Requests/sec",
20     "Web Service(*)Total Post Requests",
21     "Web Service(*)Total Put Requests",
22     "Web Service(*)Delete Requests/sec",
23     "Web Service(*)Get Requests/sec",
24     "Web Service(*)Options Requests/sec",
25     "Web Service(*)Post Requests/sec",
26     "Web Service(*)Put Requests/sec",
27     "Web Service(*)Other Request Methods/sec",
28     "HTTP Service Request Queues(*)CurrentQueueSize",
29     "HTTP Service Request Queues(*)RejectedRequests",
30     ".NET CLR Exceptions(*)# of Exceps Thrown / sec",
31     "Process(w3wp*)Thread Count",
32     "Process(w3wp*)\% Processor Time",
33     "Process(w3wp*)Working Set - Private",
34     "Process(w3wp*)Working Set",
35     "Process(w3wp*)Private Bytes"
36     )
37     $res= get-counter -counter $commandSet
38     $index=0
39     $metricAppName=""
40     $timestamp=[int] (Get-Date (Get-Date).ToUniversalTime() -uformat "%s")
41     $host_name = hostname
42     $table_name=""
43     while($res.countersamples[$index])
44     {
45         $Metrics1=@{}
46         $value= $res.countersamples[$index].cookedvalue
47         $metric=$res.countersamples[$index].path
48         $metricAppName=$res.countersamples[$index].InstanceName
49         $tempArray=$metric.replace("\","").split("")
50         $metric=$tempArray[2]
51         $Metrics1.$metric = $value
52         if($tempArray[1].startswith(''web service''))
53         {
54             $table_name = "iis_web_service"
55         }
56         Elseif($tempArray[1].startswith(''http service''))
57         {
58             $table_name = "iis_http_service"
59         }
60         Elseif($tempArray[1].startswith(''.net clr exceptions''))
61         {
62             $table_name = "iis_net_clr_exceptions"
63         }
64         Elseif($tempArray[1].startswith(''process(w3wp''))
65         {
66             $table_name = "iis_process"
67         }
68            Write-Influx -Measure $table_name -Tags @{Server = $host_name;  AppName = $metricAppName;} -Metrics $Metrics1 -Database monitor -Server http://influxdb:9096
69         $index = $index + 1
70     }
71 }
72 write-host "running...... please wait" (waitsec)"S"
73 Start-Sleep -s (waitsec)
74 while(1){
75     #执行代码
76     get-date
77     (GetData)
78     #……
79     Start-Sleep -s (waitsec)
80 }
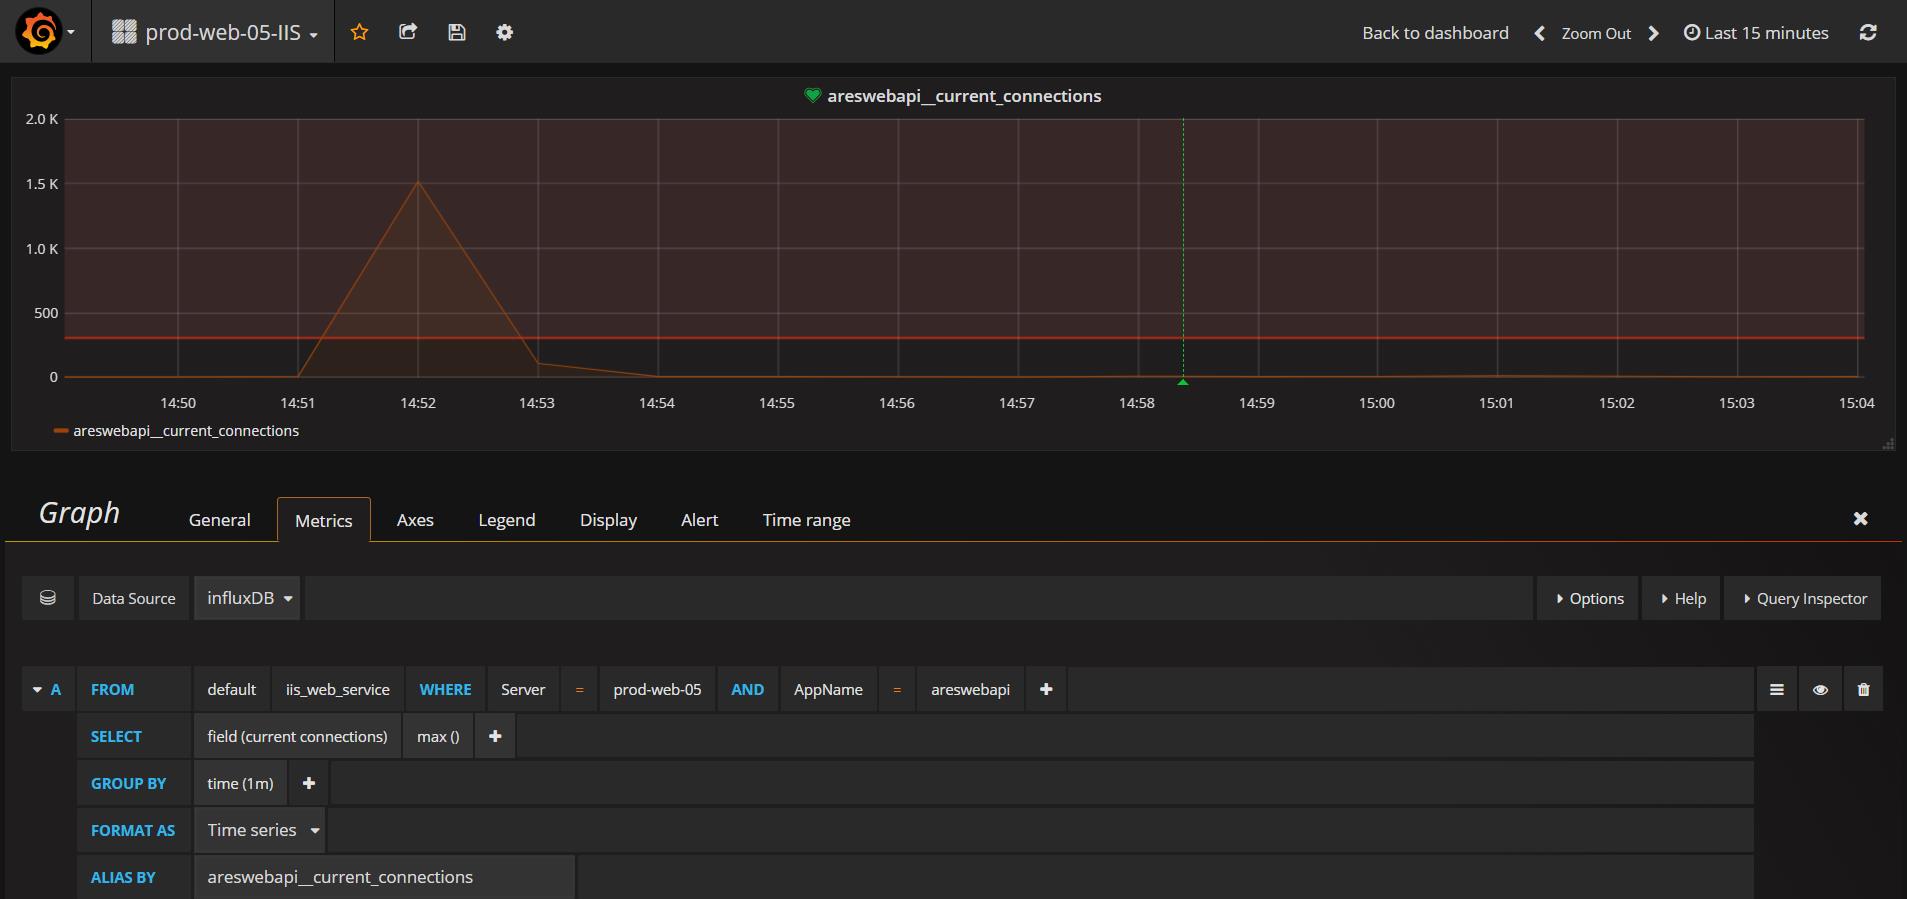
这里主要对webapi展示了当前连接数,当前排队数,和请求速率。
整体效果:
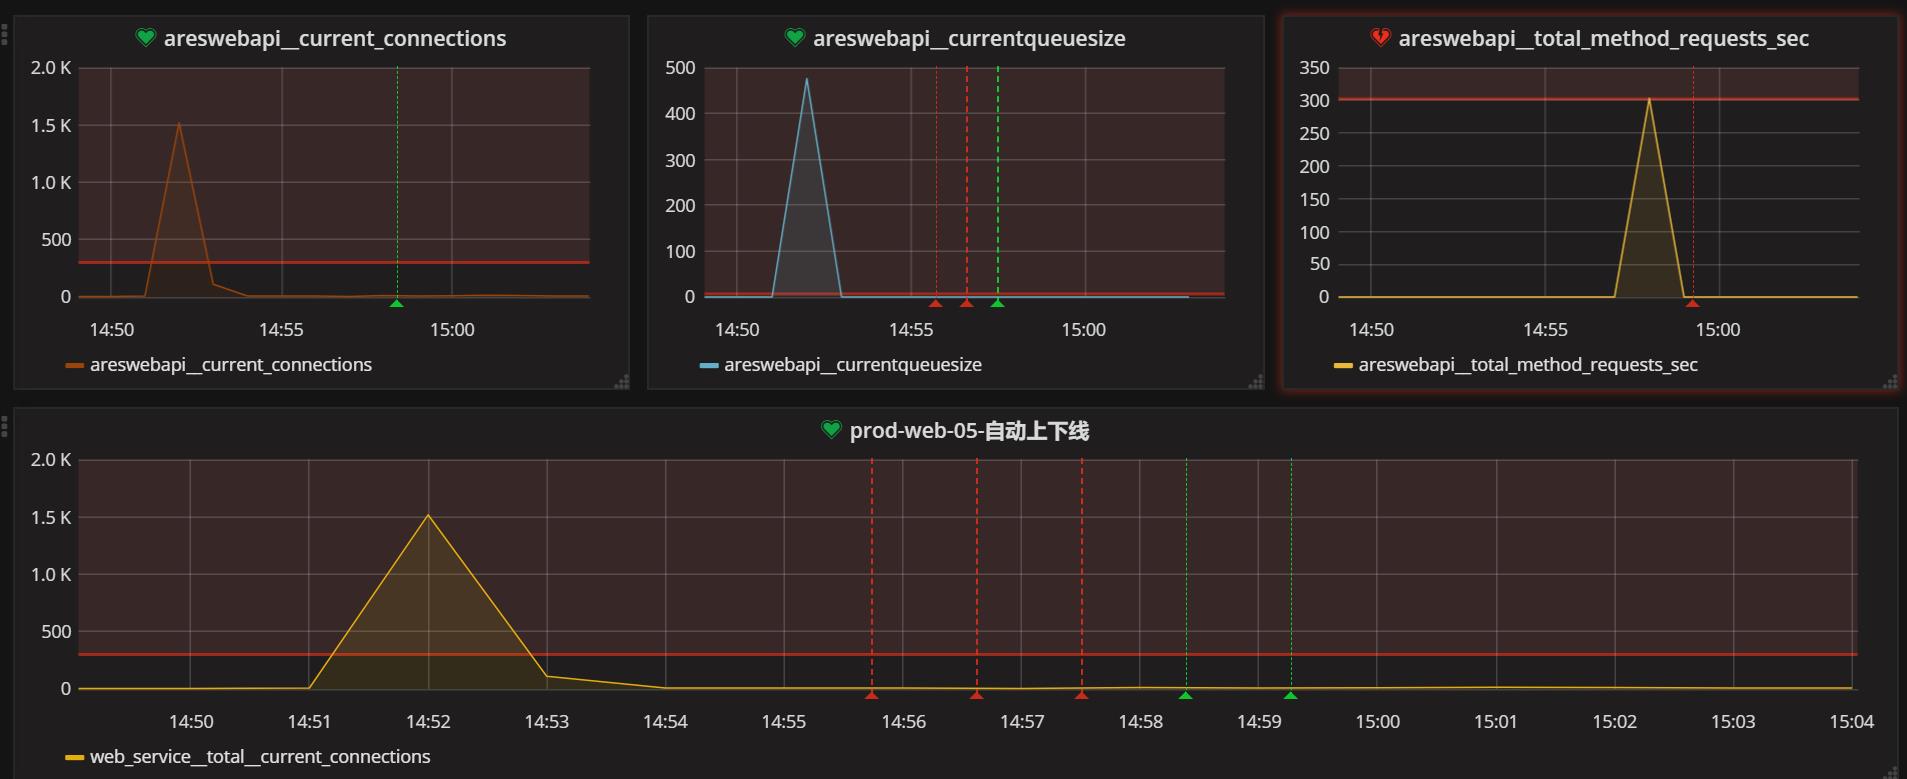
还可以在grafana告警里面设置一个WebHook,进行处理告警后的逻辑,比如:当这台机器压力比较大时可以对其进行从负载均衡移除 等等。

© 2009-2026 欢迎访问东莞柏顿软件 www.paducn.com All Rights Reserved Power by PaducnCms粤ICP备2024167885号